Inventory forecasting with POS analytics helps businesses use real sales activity, product movement, and stock data to make smarter inventory decisions. Instead of relying only on instinct, teams can review what customers actually buy, when they buy it, how quickly products move, and where inventory problems are likely to appear.
Good inventory planning matters because every stocking decision affects cash flow, customer satisfaction, storage space, and profit margin.
Too little inventory can create stockouts, missed sales, unhappy customers, and rushed supplier orders. Too much inventory can lead to overstocking, markdowns, waste, dead stock, and cash tied up in products that are not moving.
For retailers, restaurants, eCommerce sellers, service businesses with product sales, and multi-location operators, POS analytics can turn daily transactions into useful forecasting insights.
Sales history, product performance reports, reorder points, inventory turnover, sell-through rate, category performance, and real-time inventory tracking all help businesses understand demand more clearly.
Inventory forecasting is not about predicting the future perfectly. It is about improving purchasing decisions with better information. When POS data is clean, reports are reviewed regularly, and forecasts are adjusted as demand changes, businesses can build a more reliable inventory planning process.
What Inventory Forecasting With POS Analytics Means
Inventory forecasting with POS analytics means using point-of-sale data to estimate future inventory needs. A POS system records sales, refunds, discounts, product movement, category performance, customer purchase behavior, and stock changes.
When this information is organized into POS inventory reports, businesses can use it to plan what to buy, when to reorder, and how much stock to keep on hand.
At its core, inventory forecasting looks at past and current sales patterns to estimate future demand. If a product sells steadily every week, the business can forecast future needs based on average daily sales, supplier lead time, and safety stock.
If another product sells only during seasonal periods, the forecast should reflect those seasonal patterns instead of treating every month the same.
POS analytics can also show differences between product categories, locations, sales channels, and customer groups. A product may sell quickly in one store but slowly in another. A menu item may perform well during lunch but not during dinner.
An eCommerce product may spike after a promotion, then return to normal sales velocity. These details help businesses make more realistic inventory decisions.
Forecasting is not the same as guessing. Guessing depends mostly on memory or assumptions. Forecasting uses sales data analysis, stock level tracking, inventory analytics, and business judgment together.
The best results usually come when teams combine POS reporting tools with supplier knowledge, staff feedback, seasonal planning, and regular inventory review.
Why POS Analytics Matters for Inventory Planning
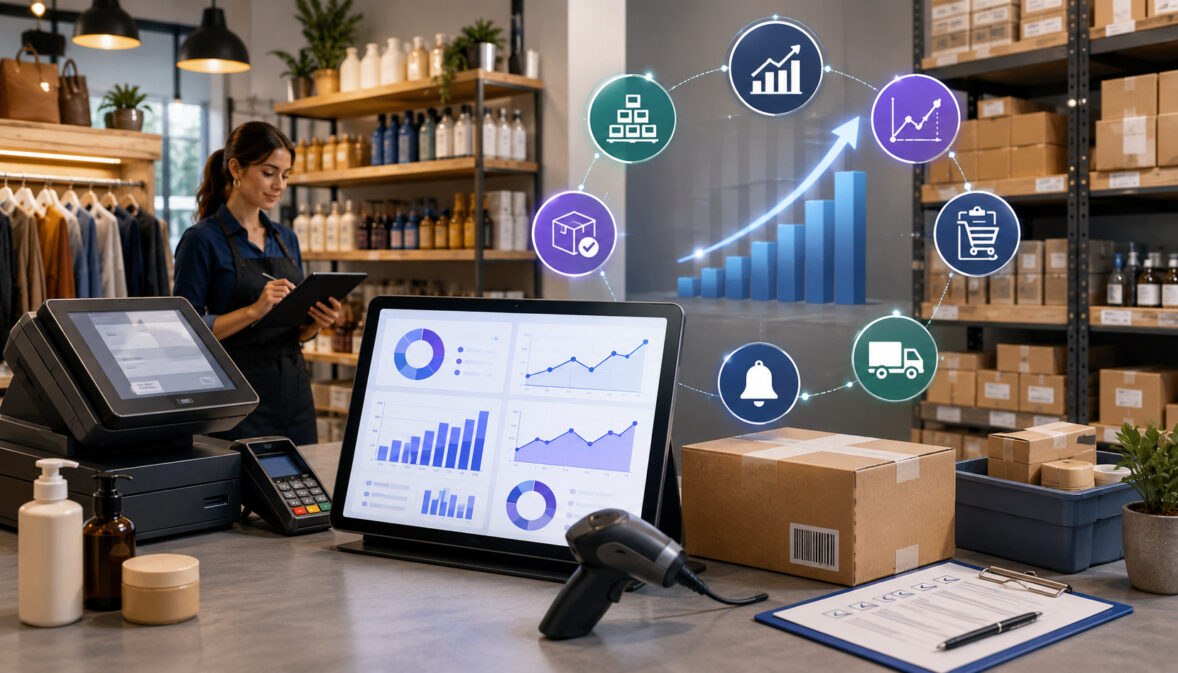
POS analytics matters because it helps businesses understand what is really happening inside their inventory. Without reliable reporting, teams may order based on memory, personal preference, supplier pressure, or last-minute urgency. That can lead to too much of the wrong stock and too little of the products customers actually want.
With POS analytics, a business can see which products are selling, when they sell, which categories are growing, which items are slowing down, and which products are regularly out of stock. These insights support better inventory planning because they connect purchasing decisions to actual customer demand.
For example, POS system reports may show that a product has strong weekend sales but weak weekday sales. A restaurant may discover that one ingredient is used heavily during lunch service but barely used at night.
A retailer may see that certain sizes, colors, or product categories sell faster at one location than another. This type of retail POS data gives managers a clearer view of demand.
POS analytics also supports cash flow. Inventory costs money before it produces revenue. When businesses over-order slow-moving inventory, cash gets tied up in products that may need discounts later.
When they under-order fast-selling products, they may lose sales and disappoint customers. Better forecasting helps balance availability with financial control.
Inventory accuracy is another major benefit. Barcode scanning, real-time reporting, stock adjustments, purchase orders, returns, and shrinkage tracking can help teams keep system records closer to physical inventory. When POS data is accurate, inventory forecasting becomes more useful because the forecast is based on cleaner information.
Key POS Data Points Used for Inventory Forecasting
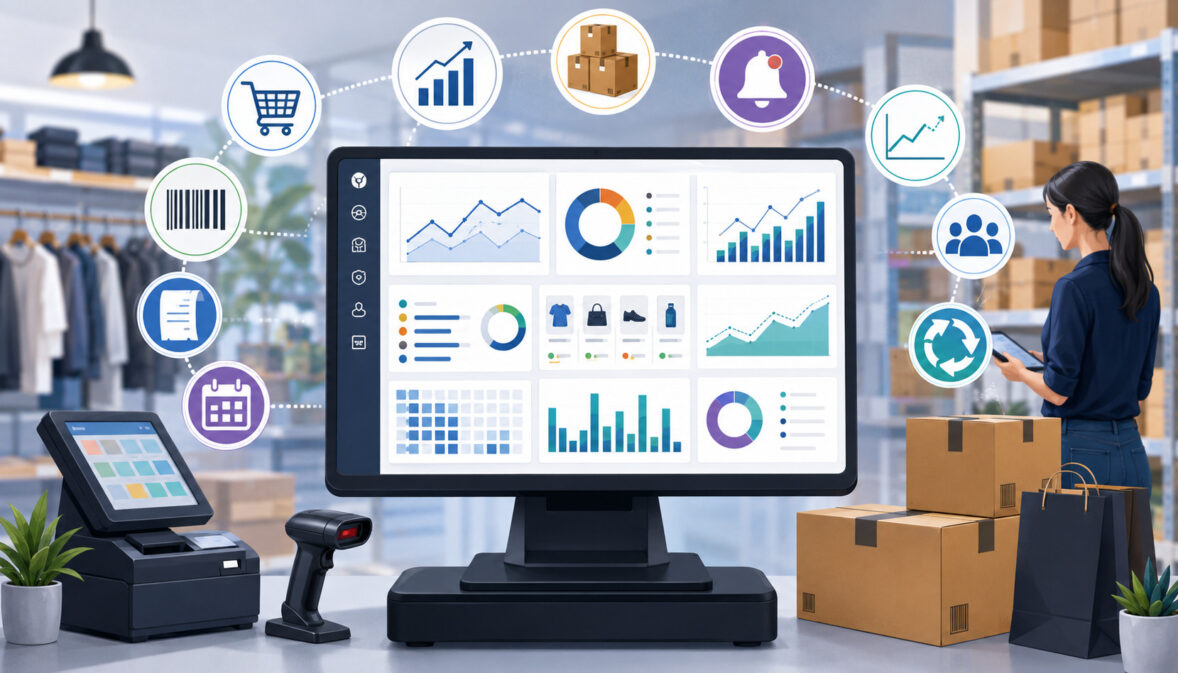
Inventory forecasting depends on the quality and usefulness of the data behind it. POS analytics can provide many data points, but not every report has the same value.
Businesses should focus on data that helps answer practical questions: What is selling? How fast is it selling? What is profitable? What is running low? What is overstocked? What should be reordered?
The most useful inventory analytics often combines sales history, SKU performance, inventory turnover, sell-through rate, reorder points, lead time, seasonal demand forecasting, and promotional trends. Each data point adds a different layer of understanding. Together, they help create a more complete picture of demand.
Sales History
Sales history is one of the most important inputs for inventory forecasting. It shows what customers bought over a selected period, including product quantities, transaction timing, category demand, and revenue trends. When businesses review sales history consistently, they can identify reliable demand patterns instead of relying only on recent memory.
A store may notice that certain products sell more at the beginning of the month, while others perform better on weekends. A restaurant may see that specific menu items increase during warmer weather or local events. An eCommerce seller may find that product demand changes after advertising campaigns, discounts, or shipping promotions.
Historical sales data also helps separate repeat demand from unusual spikes. A sudden increase in sales may be caused by a promotion, a one-time event, or a competitor running out of stock. If a business treats every spike as permanent demand, it may over-order and create dead stock.
For better forecasting, sales history should be reviewed by product, category, location, and time period. The more specific the review, the more useful the insight becomes.
Product and SKU Performance
SKU management is essential for accurate inventory forecasting. A SKU-level report shows how each individual product performs, rather than grouping everything into broad categories. This matters because products within the same category can behave very differently.
For example, one product in a category may be a best-selling item with high sales velocity, while another may be slow-moving inventory that ties up cash. Without SKU-level reporting, the overall category may appear healthy, even though some products need replenishment and others need markdowns or replacement.
Product performance reports can show units sold, gross margin, profit margin, return rate, shrinkage, discount activity, and stock on hand. These details help businesses avoid ordering only based on sales volume.
A product that sells quickly but has a weak margin may need different treatment than a product that sells slightly slower but produces stronger profit.
POS analytics can also help identify product mix problems. If too much cash is invested in low-performing SKUs, the business may not have enough budget for fast-moving products. Strong SKU reporting supports better purchasing decisions and cleaner inventory optimization.
Inventory Turnover
Inventory turnover measures how quickly inventory moves through the business. A higher turnover rate usually means products are selling and being replaced efficiently. A lower turnover rate may suggest overstocking, weak demand, poor product selection, pricing problems, or excessive purchasing.
Inventory turnover is useful because it connects sales activity to inventory investment. A business may have strong revenue, but if too much stock sits on shelves or in storage, cash flow can still suffer. Carrying costs, insurance, storage, spoilage, obsolescence, and warehouse space all add pressure when inventory moves slowly.
POS analytics can support turnover tracking by showing cost of goods sold, average inventory, units sold, and product movement by category. Businesses can compare turnover across departments, product lines, or locations to see where inventory control needs improvement.
Turnover should not be judged the same way for every product. Some staple items may turn quickly all year. Specialty products may turn more slowly but still contribute to the product mix. The key is to understand what is normal for each category and adjust forecasts accordingly.
Sell-Through Rate
Sell-through rate compares the amount of inventory sold against the amount received during a specific period. It is especially useful for retail inventory forecasting because it shows how well new stock is converting into sales.
For example, if a business receives a shipment of seasonal products and sells most of it within the expected period, the sell-through rate may indicate strong demand. If only a small percentage sells, the business may need to review pricing, display placement, product selection, or future reorder quantity.
Sell-through rate is helpful because it looks at movement over time. A product may have decent total sales but still underperform if the business received too much inventory. POS analytics helps reveal this by connecting received stock, units sold, remaining stock, discounts, and returns.
This metric is also valuable for markdown planning. If a product has a low sell-through rate early in its selling cycle, the business may act sooner with promotions, bundling, repositioning, or reduced future orders. Waiting too long can increase carrying costs and reduce profit margin.
Reorder Points and Reorder Quantity
Reorder points help businesses decide when to place a new order. Reorder quantity helps decide how much to order. POS analytics can support both by showing average daily sales, sales velocity, supplier lead time, current stock, safety stock, and historical demand changes.
A simple reorder point often considers daily demand, lead time, and safety stock. If a product sells several units per day and the supplier usually takes several days to deliver, the business needs enough stock to cover the waiting period. Safety stock adds a buffer for supplier delays, demand spikes, or inventory accuracy issues.
Reorder point automation can help reduce manual work by creating reorder alerts when inventory reaches a set threshold. However, reorder points should not be set once and forgotten. Demand changes, supplier timelines shift, and product popularity rises or falls.
POS inventory reports can help businesses update reorder points based on recent sales data. This is especially important for products affected by seasonal patterns, promotions, changing customer demand, or supply chain disruptions.
Seasonal and Promotional Sales Trends
Seasonal demand forecasting is critical for many businesses. Customer buying behavior often changes around holidays, school schedules, weather, tourism patterns, events, and local routines. A product that sells slowly during one period may become a best seller during another.
Promotions also affect demand. Discounts, bundles, loyalty offers, social campaigns, email campaigns, and limited-time deals can create temporary sales spikes. If businesses do not separate promotional demand from normal demand, future forecasts may become inflated.
POS analytics can help by showing sales trends before, during, and after promotional periods. It can also show which products benefited from the promotion and whether the increase came from new demand or pulled-forward demand. This matters because a promotion may increase short-term sales but reduce sales in the following period.
How POS Reporting Tools Improve Demand Forecasting
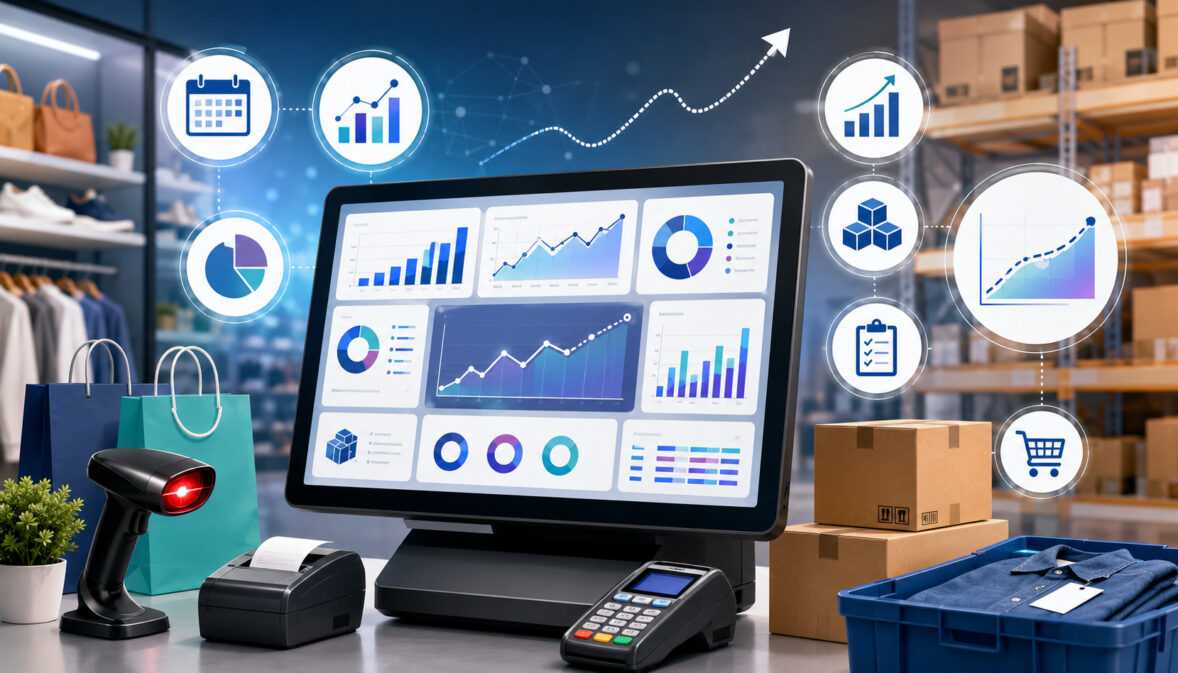
POS reporting tools improve demand forecasting by turning transaction data into reports, dashboards, charts, alerts, and product-level insights. Instead of manually sorting spreadsheets, businesses can review sales data analysis, product performance reports, real-time inventory tracking, and stock level tracking from one reporting environment.
A good reporting process helps teams spot patterns earlier. For example, POS analytics may show that a product is selling faster than usual, a category is declining, or one location is running low while another has excess stock. These insights allow teams to respond before inventory problems become expensive.
POS system reports can also support collaboration. Owners, managers, buyers, warehouse teams, and shift supervisors can work from the same data instead of using separate notes or assumptions. This reduces confusion and helps purchasing decisions become more consistent.
Reporting tools are most useful when teams review them on a regular schedule. A daily check may focus on stockouts and fast-moving items. A weekly review may cover reorder points, sales velocity, and purchase orders. A monthly review may focus on category performance, profit margin, inventory turnover, and slow-moving inventory.
Real-Time Inventory Reports
Real-time inventory reports show current stock levels as sales, returns, transfers, and adjustments happen. This is especially helpful for businesses that sell through multiple channels or operate more than one location.
Without real-time inventory tracking, a business may sell products that are no longer available, delay fulfillment, or miss reorder needs. This can frustrate customers and create extra work for staff. Real-time reporting helps teams understand what is available now, not just what was available during the last manual count.
These reports can also help prevent overselling. If an item is sold online and in-store, inventory records should update quickly so another customer does not purchase the same item after it is gone. For high-demand products, even a small delay can create fulfillment issues.
Real-time reports are not perfect unless the underlying inventory data is accurate. Businesses still need reliable receiving, barcode scanning, return handling, shrinkage tracking, and physical counts.
Category Performance Reports
Category performance reports show how different product groups are performing. Instead of only reviewing individual SKUs, businesses can analyze broader product categories, departments, menu groups, or service-related product lines.
These reports help identify which categories drive revenue, which categories produce strong gross margin, and which categories may be declining. A category may generate high sales but weak profit if discounts, waste, or costs are too high. Another category may sell less frequently but contribute a strong profit margin.
Category reports also support purchasing priorities. If a category is growing steadily, the business may allocate more buying budget to that area. If a category is slowing down, the team may reduce reorder quantity, test new products, adjust pricing, or improve merchandising.
For inventory planning, category performance helps prevent over-focusing on individual products. A balanced product mix requires understanding both SKU performance and category-level trends.
Multi-Location Inventory Reports
Multi-location inventory management requires more than knowing total stock across the business. Each location may have different customer demand, product preferences, sales velocity, and storage capacity. POS analytics can help compare store performance and inventory levels by location.
A product may be overstocked in one store but out of stock in another. Without location-level reporting, the business might place a new purchase order even though enough inventory already exists elsewhere. Multi-location reports can reveal transfer opportunities that reduce over-ordering and improve stock availability.
These reports can also help identify local demand patterns. One location may sell more premium products, while another sells more value-focused items. A restaurant group may see different menu item demand across neighborhoods. An eCommerce warehouse may need different stock planning than a physical retail location.
Benefits of Using POS Data for Inventory Forecasting
Using POS data for inventory forecasting can improve several parts of business operations. The most obvious benefit is better stock availability. When businesses understand sales velocity, reorder points, and average daily sales, they can restock important products before they run out.
Another benefit is overstock reduction. POS analytics can reveal slow-moving inventory, low sell-through rate, weak category performance, and products that are tying up cash. This helps businesses reduce unnecessary purchasing and avoid filling shelves or storage areas with items that do not sell.
Cash flow can also improve when inventory planning becomes more disciplined. Inventory requires upfront investment. If too much cash is tied up in dead stock, the business may have less flexibility for payroll, rent, marketing, supplier payments, or higher-demand products. Better forecasting helps align purchasing with realistic demand.
Customer experience also benefits. Shoppers expect popular products to be available. Restaurant customers expect menu items to be in stock. Online buyers expect accurate availability. Stockout prevention helps protect trust and reduces the frustration that comes from unavailable items.
POS analytics can also support better supplier planning. When businesses know their demand patterns, they can place purchase orders earlier, negotiate better quantities, prepare for supplier delays, and plan around minimum order requirements. This creates a more stable replenishment process.
Inventory Forecasting Metrics Every Business Should Track
Inventory forecasting works best when teams track a focused set of metrics. Too many reports can create confusion, while too few can hide important problems. The goal is to measure the factors that directly affect purchasing, replenishment, stockout prevention, overstock reduction, and profit margin.
The table below highlights practical inventory forecasting metrics and how POS analytics can support them.
| Metric | What It Measures | Why It Matters | How POS Analytics Helps Track It |
| Sales velocity | How quickly a product sells over time | Helps estimate future demand and reorder timing | Shows units sold by day, week, category, SKU, and location |
| Average daily sales | Typical number of units sold per day | Supports reorder point and safety stock planning | Calculates product movement over selected periods |
| Inventory turnover | How quickly inventory is sold and replaced | Shows whether stock is moving efficiently | Connects sales, cost, and average inventory data |
| Sell-through rate | Percentage of received inventory sold in a period | Helps identify strong or weak product demand | Compares received stock with units sold |
| Reorder point | Stock level that triggers replenishment | Helps prevent stockouts before inventory runs out | Uses sales velocity, lead time, and safety stock |
| Safety stock | Extra inventory kept as a buffer | Helps protect against demand spikes and supplier delays | Supports planning based on historical variation |
| Lead time | Time between ordering and receiving stock | Helps determine when to reorder | Tracks supplier timelines and receiving history |
| Gross margin | Revenue left after product cost | Helps avoid buying products that sell but do not profit well | Connects sales price, cost, discounts, and product performance |
| Stockout frequency | How often products run out | Shows where lost sales may occur | Highlights items repeatedly reaching zero stock |
| Return rate | Percentage of products returned | Helps adjust demand and product quality assumptions | Tracks returns by SKU, category, and reason |
| Shrinkage | Inventory loss from theft, damage, error, or waste | Protects inventory accuracy and profit | Compares expected stock with actual counts |
| Markdown rate | Discounting used to move products | Reveals overstock or weak demand | Tracks price reductions and their effect on sales |
| Category performance | Sales and margin by product group | Supports product mix and buying strategy | Organizes sales by category, department, or menu group |
| Store performance | Product demand by location | Helps balance stock across locations | Compares sales, stock levels, and transfers by location |
These metrics are most valuable when reviewed together. A product with high sales velocity may still have weak profit margin. A product with low turnover may still be necessary for customer choice. A product with strong sell-through may need more safety stock if supplier lead time is unpredictable.
Step-by-Step Guide to Forecast Inventory With POS Analytics
A practical forecasting process does not need to be overly complicated. Many businesses can start with a simple workflow that uses POS inventory reports, sales history, current stock, supplier lead times, and reorder points. The process can become more advanced as the business grows.
The most important thing is consistency. Forecasting once and ignoring the results will not improve inventory control. Businesses should review reports regularly, update assumptions, and compare forecasted demand with actual sales.
Step One: Review Historical Sales Data
Start by reviewing historical sales data for each product, category, location, and sales channel. Look at enough data to identify patterns, but avoid mixing periods that behave very differently. For example, seasonal products should be reviewed against similar seasonal periods, not only recent weeks.
Focus on units sold, not just revenue. Revenue can rise because of price changes, but units sold show actual product movement. For inventory planning, quantity matters because it determines how much stock needs to be available.
Also review sales by day of week, time period, and location. A product that sells steadily across all days may need a different replenishment strategy than one that sells mostly on weekends or during events.
Historical sales data should be the starting point, not the final answer. Adjust the forecast for upcoming promotions, supplier changes, pricing updates, customer demand shifts, and known seasonal patterns.
Step Two: Clean and Organize Product Data
Clean product data is essential for useful inventory analytics. If product names, SKUs, barcodes, categories, costs, or units of measure are inconsistent, POS reports may become misleading.
For example, the same product should not appear under several slightly different names. A restaurant ingredient should not be tracked in one unit for purchasing and another unit for recipe usage without a clear conversion. A retail item should not be assigned to the wrong category if category performance reports are used for buying decisions.
Businesses should regularly review product records and correct duplicates, inactive SKUs, missing costs, incorrect barcode data, and outdated categories. This improves reporting quality and helps teams trust the forecast.
Good product organization also supports staff training. When employees receive stock, scan items, process returns, or adjust inventory, consistent product data reduces errors.
Step Three: Identify Fast-Moving and Slow-Moving Products
Next, separate fast-moving products from slow-moving inventory. Fast-moving products need close reorder point monitoring because stockouts can happen quickly. Slow-moving products need careful review because they may tie up cash, take up space, and require markdowns.
POS analytics can identify fast movers by sales velocity, average daily sales, turnover, and stockout frequency. These products often deserve higher attention, more frequent ordering, or additional safety stock.
Slow-moving products can be identified through low sell-through rate, weak category performance, low turnover, and long days on hand. Not every slow mover should be removed. Some products support customer choice, complete a product mix, or sell seasonally. However, slow movement should always be understood.
This step helps businesses prioritize. Inventory teams do not need to treat every SKU the same. High-demand products deserve stronger replenishment controls, while slow sellers may need reduced reorder quantities or a different merchandising strategy.
Step Four: Set Reorder Points
Reorder points help businesses restock before products run out. A basic reorder point can be built around average daily sales, supplier lead time, and safety stock.
For example, if a product sells steadily and the supplier takes several days to deliver, the reorder point should cover expected sales during that lead time. Safety stock adds extra protection for demand spikes, receiving delays, or inventory count errors.
POS analytics can help calculate these inputs by showing product movement, daily demand, sales velocity, and historical stockout patterns. Supplier records and receiving reports help estimate lead time.
Reorder points should be reviewed regularly. A product that becomes more popular may need a higher reorder point. A product that slows down may need a lower reorder point. If supplier lead time increases, reorder points may need adjustment even if demand stays the same.
Step Five: Adjust Forecasts for Seasonality and Promotions
Seasonality and promotions can change demand significantly. Businesses should adjust forecasts when customer demand is influenced by holidays, weather, local events, school schedules, tourism, advertising, or discounts.
A common mistake is using recent promotional sales as normal demand. If a product sold quickly because of a discount, future demand may return to normal after the promotion ends. POS reporting tools can help compare promoted periods with non-promoted periods.
Seasonal patterns should be reviewed by product and category. Some items may peak sharply during a specific period, while others may rise gradually. Restaurants may see seasonal ingredient usage changes, while retailers may see changes in sizes, colors, styles, or product categories.
Forecast adjustments should be documented. When teams record why demand changed, future planning becomes more accurate and easier to explain.
Step Six: Review Forecast Accuracy Regularly
Inventory forecasting should be reviewed often because demand, pricing, suppliers, customer preferences, and product trends change. A forecast that worked earlier may become inaccurate if supplier delays increase, a competitor changes pricing, or customer demand shifts.
Forecast accuracy review means comparing expected sales with actual sales. If the forecast was too high, the business may have over-ordered. If the forecast was too low, the business may have risked stockouts. The goal is not perfection. The goal is continuous improvement.
Businesses should also review why the forecast missed. Was the sales spike caused by a promotion? Did weather affect demand? Was there a stockout that limited sales? Did shrinkage make system inventory inaccurate? Did supplier delays reduce availability?
How Inventory Forecasting Helps Prevent Stockouts
Stockouts happen when customer demand exceeds available inventory. They can lead to lost sales, frustrated customers, poor reviews, interrupted operations, and emergency purchasing. Inventory forecasting with POS analytics helps reduce stockout risk by identifying products that are likely to run low before they reach zero.
POS analytics can show products nearing reorder points, items with rising sales velocity, locations with low availability, and products that repeatedly sell out. Reorder alerts can help staff act sooner, while stock level tracking helps managers see which items need attention.
Stockout prevention also depends on lead time planning. A product may look safe today, but if the supplier takes a long time to deliver, the business may already be at risk. Forecasting helps connect current stock to expected demand during the supplier waiting period.
For multi-location businesses, POS inventory reports can show whether one location has excess stock while another is running low. In some cases, transferring inventory may prevent a stockout faster than placing a new purchase order.
Stockout prevention is not about keeping unlimited inventory. Holding too much stock creates other problems. The better goal is to keep enough inventory to meet realistic demand while managing cash flow, storage space, and carrying costs.
How Inventory Forecasting Helps Reduce Overstock
Overstock happens when a business carries more inventory than it can sell within a reasonable period. It can create cash flow pressure, storage problems, markdowns, waste, spoilage, and dead stock. POS analytics helps reduce overstock by showing which products are slowing down and which purchases may need to be reduced.
Slow-moving inventory can be identified through low sales velocity, weak sell-through rate, low inventory turnover, and long days on hand. Product performance reports can also show whether discounts are needed to move inventory or whether the product should be ordered less often.
Overstock reduction is especially important for products with expiration dates, seasonal relevance, style changes, or limited shelf space. Restaurants may face waste from perishable ingredients. Retailers may face markdowns when seasonal products do not sell. eCommerce sellers may face storage fees or fulfillment delays when too much inventory sits in a warehouse.
Better forecasting supports more disciplined purchasing decisions. Instead of buying large quantities because a supplier offers a discount, businesses can compare the deal against expected demand, storage capacity, carrying costs, and cash flow needs.
Inventory Forecasting for Different Business Types
Inventory forecasting works differently depending on the business model. The basic idea is the same: use sales data, stock data, and demand patterns to plan inventory. However, the way businesses apply POS analytics depends on products, customers, sales channels, and operational needs.
Retail stores often focus on SKU sales, category performance, seasonal demand, and product assortment. Restaurants may focus on menu item sales, ingredient usage, waste, and peak service periods.
eCommerce sellers may focus on order volume, fulfillment timelines, returns, and advertising impact. Multi-location businesses need location-level reporting and transfer planning.
Retail Stores
Retail stores can use POS analytics to forecast inventory by SKU, category, location, season, and customer buying behavior. Product performance reports help retailers see which items sell quickly, which items need replenishment, and which products are becoming slow movers.
Retail inventory forecasting should also consider product variations. Size, color, style, brand, and price point can affect demand. A category may perform well overall, but certain variations may sell faster than others. SKU-level reporting helps prevent over-ordering weak variations while under-ordering popular ones.
Retailers should also review seasonal patterns, markdowns, returns, and shrinkage. A product that appears to have weak sales may have suffered from poor placement, stockouts, or inventory errors. POS analytics gives useful clues, but staff feedback and merchandising review are also important.
Strong forecasting helps retailers maintain better product availability, reduce dead stock, improve product mix, and protect cash flow.
Restaurants and Food Businesses
Restaurants and food businesses can use POS analytics to forecast menu item demand, ingredient usage, waste, supplier ordering, and peak service periods. Every menu sale affects inventory because ingredients are consumed behind the scenes.
A restaurant may use sales history to estimate how many servings of a menu item are likely to sell during a specific daypart. That can help plan prep levels, ingredient orders, and staffing needs. If a menu item sells heavily during lunch but not dinner, the forecast should reflect that pattern.
Food businesses also need to consider spoilage and storage limits. Overstocking perishable ingredients can lead to waste, while understocking can force menu substitutions or unavailable items. POS analytics helps connect menu demand with inventory planning.
Promotions, weather, local events, and delivery orders can also affect demand. Regular report reviews help restaurants adjust purchasing before problems occur.
eCommerce Businesses
eCommerce businesses can use POS or order data to forecast inventory by product demand, fulfillment timelines, returns, advertising performance, and sales channel activity. Online demand can change quickly, especially when campaigns, marketplace rankings, influencer mentions, or discounts affect visibility.
Inventory forecasting for eCommerce should consider available stock, committed stock, warehouse processing time, shipping timelines, and return rates. A product may appear available in the system, but some units may already be allocated to pending orders or returns inspection.
Online sellers should also review product page performance, abandoned carts, and promotion history where available. POS analytics and order reports can show what sold, but broader sales data analysis can help explain why demand changed.
Forecasting helps eCommerce businesses avoid overselling, reduce storage costs, plan purchase orders, and maintain better fulfillment reliability.
Multi-Location Businesses
Multi-location businesses need inventory forecasting that accounts for demand differences by store, warehouse, region, or sales channel. Total inventory can be misleading if products are not in the right place.
POS analytics can compare store performance, product movement, stock levels, and transfer opportunities. If one location has too much inventory and another location has too little, transferring stock may improve availability without increasing total inventory investment.
Location-level forecasting also helps businesses avoid treating all stores the same. A product may be a top seller in one area and a slow mover in another. Ordering the same quantity for every location can create both stockouts and overstock at the same time.
Multi-location inventory management works best when businesses review local demand, storage capacity, staff feedback, supplier delivery options, and transfer costs together.
Common Inventory Forecasting Mistakes to Avoid
Inventory forecasting becomes less useful when businesses rely on poor data, outdated assumptions, or incomplete reports. One common mistake is relying on guesswork. Experienced managers often have valuable instincts, but memory alone can miss product-level details, seasonal changes, and slow shifts in customer demand.
Another mistake is ignoring seasonal demand. If a business forecasts only from recent sales without considering seasonal patterns, it may under-order before a demand spike or over-order after demand fades. Promotions can create the same problem if temporary sales increases are mistaken for normal demand.
Dirty product data is another major issue. Duplicate SKUs, incorrect barcodes, missing costs, wrong categories, and inconsistent product names can make POS inventory reports unreliable. Forecasting based on messy data can lead to poor purchasing decisions.
Some businesses track sales but ignore margins. A product that sells quickly may not be as valuable if it has low profit margin, high return rate, or heavy discounting. Inventory planning should include gross margin and markdown activity, not just unit sales.
Supplier lead time is also easy to overlook. A product with steady demand can still stock out if the business waits too long to reorder. Reorder points should include lead time and safety stock.
Other mistakes include:
- Setting reorder points once and never updating them.
- Overreacting to short-term sales spikes.
- Ignoring returns, shrinkage, and damaged goods.
- Treating every location as if demand is identical.
- Ordering too much to qualify for supplier discounts.
- Failing to compare forecasted demand with actual sales.
POS Analytics and Supplier Planning
POS analytics can improve supplier planning by helping businesses place better purchase orders, estimate reorder quantities, and prepare for supplier delays. Forecasting is not only about customer demand. It must also account for how long it takes to receive inventory and how suppliers handle order minimums, substitutions, and delivery schedules.
Supplier lead time is one of the most important planning factors. If a product sells quickly and the supplier takes longer to deliver, the business needs a higher reorder point or more safety stock. If lead time is unpredictable, the forecast should include a buffer.
POS analytics can also help businesses communicate with suppliers. Instead of placing rushed orders, buyers can use sales history, inventory turnover, sell-through rate, and seasonal demand forecasting to plan ahead. This can make supplier conversations more specific and practical.
Minimum order quantities should also be included in the forecast. A supplier may require a larger order than the business actually needs. In that case, the buyer should consider storage space, cash flow, carrying costs, expected sales, and markdown risk before ordering.
For seasonal demand, supplier planning should begin early. If many businesses order the same products during peak periods, delays may become more likely. POS analytics can help estimate demand before the busy period begins.
How to Build a Simple Inventory Forecasting Workflow
A simple inventory forecasting workflow helps small teams stay consistent without becoming overwhelmed. The workflow should include regular report reviews, clean data checks, reorder planning, supplier updates, and forecast accuracy review.
A weekly review can focus on fast-moving products, low-stock alerts, stockout risks, and upcoming purchase orders. This keeps replenishment active and helps prevent urgent ordering. Teams should review sales velocity, current stock, reorder points, and supplier lead time for priority products.
A monthly review can focus on category performance, slow-moving inventory, markdowns, inventory turnover, sell-through rate, and profit margin. This helps the business adjust product mix and reduce overstock.
A simple workflow may include:
- Review sales history and product performance weekly.
- Check reorder alerts and low-stock items.
- Confirm supplier lead times before placing purchase orders.
- Review slow-moving inventory monthly.
- Compare category performance and margin trends.
- Adjust reorder points when demand changes.
- Review seasonal demand before peak periods.
- Compare forecasted sales with actual sales.
- Investigate stockouts, shrinkage, and returns.
- Update product data and barcode records as needed.
This workflow does not need to be complicated. The goal is to create a repeatable process that turns POS analytics into better inventory control.
Inventory Forecasting Checklist
The checklist below can help businesses review whether their forecasting process is ready to support better purchasing decisions.
| Checklist Item | Why It Matters | Review Frequency |
| Product names and SKUs are clean | Prevents duplicate or misleading reports | Monthly |
| Barcodes are accurate | Improves scanning and inventory accuracy | Monthly |
| Product categories are organized | Supports category performance analysis | Monthly |
| Sales history is reviewed | Helps identify demand patterns | Weekly |
| Fast-moving products are monitored | Supports stockout prevention | Weekly |
| Slow-moving inventory is reviewed | Helps reduce overstock and dead stock | Monthly |
| Reorder points are set | Helps trigger replenishment before stockouts | Weekly |
| Safety stock is planned | Protects against demand spikes and delays | Monthly |
| Supplier lead times are tracked | Improves reorder timing | Monthly |
| Purchase orders are compared with forecasts | Helps prevent overbuying | Weekly |
| Inventory counts are checked | Improves data reliability | Scheduled cycle counts |
| Returns and shrinkage are reviewed | Protects forecast accuracy | Monthly |
| Seasonal patterns are documented | Improves seasonal demand forecasting | Before peak periods |
| Forecast accuracy is reviewed | Helps improve future planning | Monthly |
FAQs
What is inventory forecasting with POS analytics?
Inventory forecasting with POS analytics is the process of using POS data to estimate future inventory needs. It looks at sales history, product movement, stock levels, category performance, reorder points, lead time, and seasonal patterns to help businesses decide what to order and when to order it.
The goal is not to predict demand perfectly. The goal is to make better inventory decisions using real sales and inventory data. When businesses review POS reports regularly, they can reduce guesswork and respond more quickly to demand changes.
How does POS analytics help with inventory forecasting?
POS analytics helps by showing what customers are buying, how quickly products are selling, which items are slowing down, and which products are nearing reorder points. It can also show demand by category, location, channel, and time period.
This information supports better inventory planning because it connects purchasing decisions to actual sales behavior. Businesses can use POS analytics to spot stockout risks, reduce overstock, plan purchase orders, and adjust forecasts when demand changes.
What POS reports are useful for inventory planning?
Useful POS reports include sales history reports, product performance reports, inventory turnover reports, sell-through reports, low-stock reports, reorder reports, category performance reports, stock adjustment reports, return reports, and multi-location inventory reports.
Each report answers a different question. Sales reports show demand. Product reports show SKU performance. Low-stock reports show reorder needs. Category reports show broader trends. Together, these reports help businesses make more informed purchasing decisions.
Can small businesses use POS data for demand forecasting?
Yes, small businesses can use POS data for demand forecasting even if they do not have a large analytics team. A simple process can begin with reviewing sales history, identifying best-selling products, tracking average daily sales, setting reorder points, and checking low-stock reports weekly.
Small businesses should start with the products that matter most, such as fast-moving items, high-margin products, perishable goods, or products that frequently run out. Over time, the process can become more detailed as the business improves its data and reporting habits.
What is the difference between inventory analytics and inventory forecasting?
Inventory analytics is the broader process of reviewing inventory-related data. It includes sales trends, stock levels, product performance, inventory turnover, shrinkage, returns, margins, and category performance.
Inventory forecasting uses that data to estimate future demand and plan inventory. In other words, inventory analytics helps explain what has happened and what is happening now. Inventory forecasting uses those insights to guide future purchasing and replenishment decisions.
How often should inventory forecasts be updated?
Inventory forecasts should be updated regularly because demand, supplier lead times, pricing, and customer behavior can change. Fast-moving products may need weekly review, while slower products may only need monthly review.
Businesses should also update forecasts before seasonal periods, major promotions, supplier changes, new product launches, or local events. Forecast accuracy should be reviewed often so the business can learn from missed estimates and improve future planning.
How can POS analytics help prevent stockouts?
POS analytics helps prevent stockouts by showing products that are selling quickly, items nearing reorder points, and locations with low stock. Low-stock alerts, reorder reports, and sales velocity tracking can help teams act before inventory reaches zero.
It can also reveal recurring stockout patterns. If a product runs out repeatedly, the business may need to raise the reorder point, increase safety stock, order earlier, or review supplier lead time.
How can POS analytics reduce overstock?
POS analytics reduces overstock by identifying slow-moving inventory, weak sell-through rates, declining categories, high markdown activity, and products with too much stock on hand. This helps businesses avoid unnecessary purchasing.
Better forecasting can also help reduce carrying costs, storage pressure, spoilage, and cash tied up in unsold products. When businesses understand realistic demand, they can order more carefully and reduce the risk of dead stock.
What inventory metrics should businesses track?
Businesses should track sales velocity, average daily sales, inventory turnover, sell-through rate, reorder point, safety stock, supplier lead time, stockout frequency, gross margin, return rate, shrinkage, markdown rate, and category performance.
The right metrics depend on the business type. A restaurant may focus heavily on ingredient usage and waste, while a retailer may focus more on SKU performance and sell-through rate. The key is to track metrics that support better purchasing decisions.
How do reorder points work with POS data?
Reorder points use demand and lead time to determine when a product should be reordered. POS data helps calculate average daily sales and sales velocity, while supplier records help estimate lead time. Safety stock adds a buffer for demand spikes or delays.
For example, if a product sells steadily and takes time to arrive from the supplier, the reorder point should be high enough to cover expected sales while waiting for the next shipment. POS analytics can help update reorder points as sales patterns change.
Can POS analytics help multi-location businesses manage inventory?
Yes, POS analytics can help multi-location businesses compare demand, stock levels, and product performance by location. This makes it easier to see where products are selling quickly and where inventory may be sitting too long.
Multi-location reports can also support inventory transfers. If one store has excess stock and another is running low, a transfer may solve the problem without placing a new supplier order. This helps balance inventory and reduce over-ordering.
Conclusion
Inventory forecasting with POS analytics helps businesses turn everyday sales activity into better inventory decisions. By reviewing sales history, product performance, inventory turnover, sell-through rate, reorder points, category trends, and real-time inventory reports, teams can better understand customer demand and plan stock more responsibly.
Good forecasting can support stockout prevention, overstock reduction, stronger cash flow, better supplier planning, and more accurate purchasing decisions. It can also help businesses identify best-selling products, slow-moving inventory, seasonal patterns, and location-level demand differences.
POS analytics should not be treated as a perfect prediction tool. Demand can change because of weather, promotions, local events, supplier delays, pricing shifts, and customer behavior. That is why accurate forecasting depends on clean product data, reliable stock counts, realistic reorder points, supplier lead time review, and ongoing report analysis.
When businesses use POS analytics consistently, inventory planning becomes more data-driven and less reactive. The result is a stronger inventory control process that helps teams buy smarter, replenish sooner, reduce waste, and serve customers with more confidence.